Today I experimented with reception of images from a high altitude balloon that has been started a few kilometres away. From the information beforehand I learned that it transmitted live pictures and APRS position data. Only with googling I found out that the mode was realliy SSDV. From first reading I had SSTV in mind. But this was a kind of digital transmission of pictures using RTTY in the end. The complete project is described on [1].
First of all decoding these kind of pictures required a new piece of software. I used the sources from [2] and compiled dl-fldigi on an Ubuntu 14.04.02 LTS. Considering the tips mentioned there compilation worked like a charm. But as not much time was left I had to give the first try with live data from the balloon. I knew that the settings were RTTY with 600 bits/s and 610Hz shift as well as 8 data bits, no parity and 1 stop bit.
The equipment on the vehicle was a 10mW SSDV transmitter that was fed from a live camera on a Raspberry Pi. The image data was encoded according to the SSDV standard and then transmitted on 70cm (434.650 MHz USB). Seeing the signal on the waterfall moving I remembered to correct the doppler shift as the balloon was of course moving. In contrast to tracking the ISS or other satellites with a piece of software I had to correct the doppler shift manually.
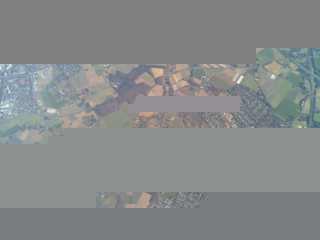
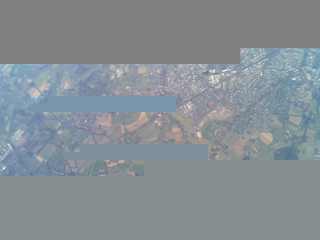
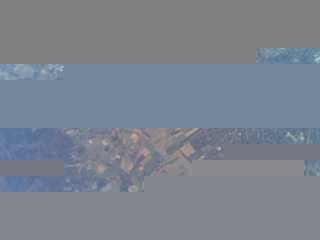
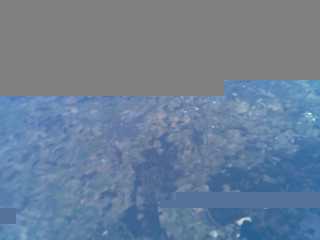
As soon as the balloon was up in the air I could decode some pieces of data. Despite the fact that I just had a portble antenna on the balcony that worked quiet good. I received parts of five images shown below. The pictures were automatically uploaded to habhub.org (See [3]). It seems like they have a software running that reconstructs complete images with partly received data from various stations. So my contributions to a few pictures are mentiioned there as well.
Here are my received and decoded pictures:

I also recorded the 70cm signals as a .wav file. If you are interested you can find the file here:
And I also grabbed a set of frames in a text file with the APRS frames that were send out by the balloon and could be receiced directly by my digipeater DB0REC in Recklinghausen:
I converted the APRS raw data to a .gpx file in order to do a bit of statistics and to visualize a few things. The GPX file can be found here:
A bit of statistics:
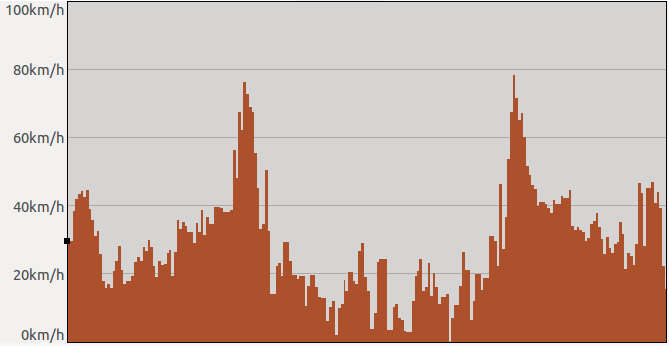
- max speed: 78,36km/h
- max altitude: 23089m
- duration: 112 minutes
- track length: 54,01km
- waypoints: 199
A map of the flight
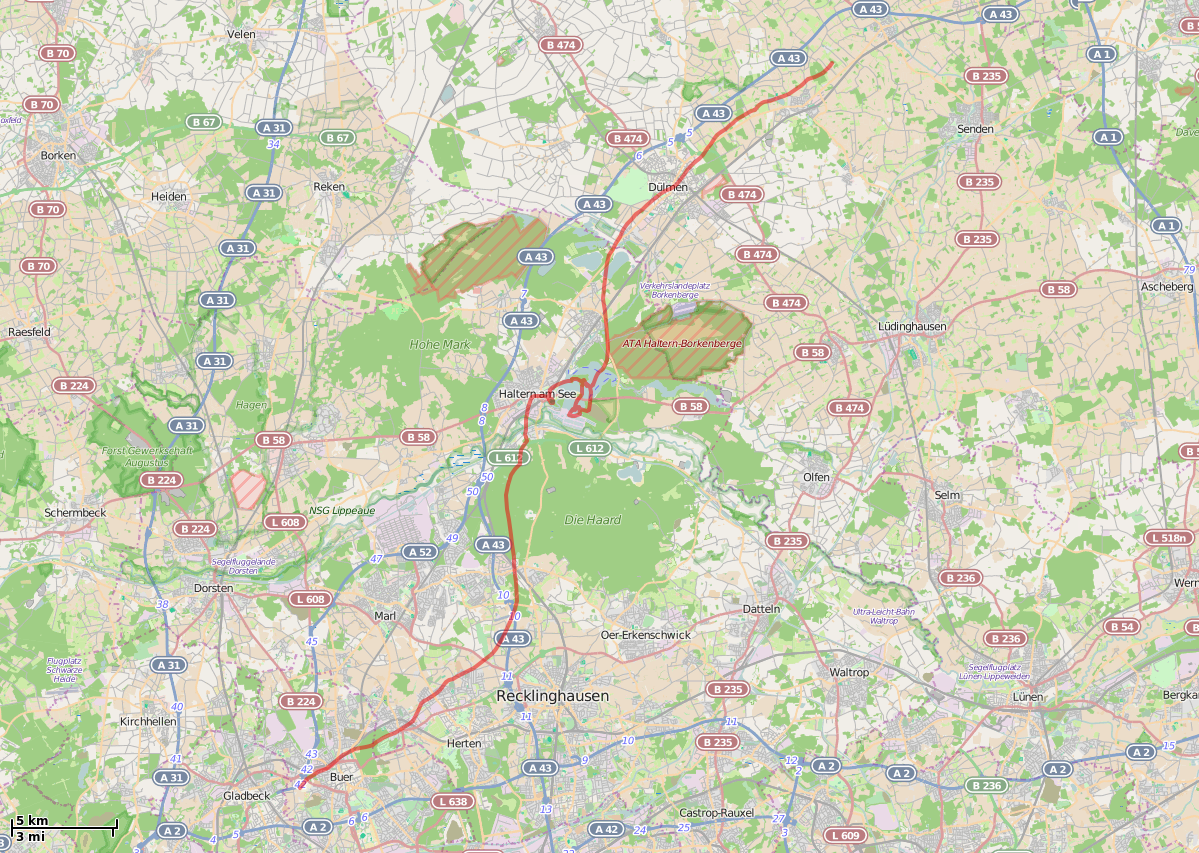
Diagram with altitude over distance
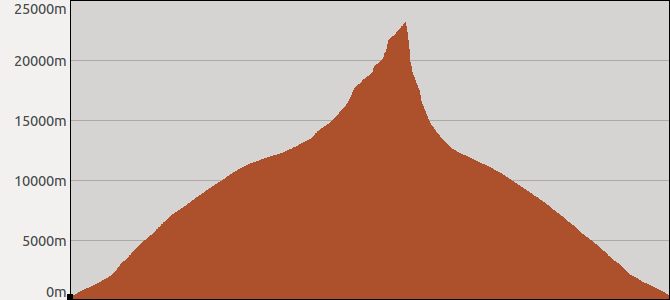
Diagram with speed over distance
References
[1] http://www.mikroelektronik.w-hs.de/index.php/stratosphaerenballon/gesamtsystem/kommunikation
[2] http://ukhas.org.uk/projects:dl-fldigi
[3] http://ssdv.habhub.org/